Are you man or woman enough to read CRASH? Can you afford to? Is CRASH your style? Do you watch the Beeb a lot? All these and many more vital questions will be answered in the next few lines — stay tuned to this column.
Yes, it’s the annual CRASHTIONNAIRE SHOW, and your host tonight is the ever-effervescent, eternally ebullient, eponymously and exacerbatingly entertaining Lloyd (largest marrows in the land) Mangram...
Good evening, and thank you. And tonight’s first contestant to take the chair will be answering questions about sex. CRASH is pretty unequivocal about its gender, with 98.4% of those who answered the questionnaire saying they are male, with a mere slip of a gel being 1.6%.
And what of the age of tonight’s contestants? Well, the largest single age group turns out to be 14 years, though a few crustier readers bring the age of the average CRASH reader up to 16.14 years (down slightly from last year’s figure).

Not surprisingly, then, when we turn to occupations 75.55% say they are still at school, no doubt playing computer games when they should be revising for their examinations. Get those certificates, guys, otherwise you won’t be joining the 6.31% at college or university who also read CRASH, or the 11.42% who enjoy full-time work. Of the rest 1.7% are in part-time work and 5.01% are unemployed, which is well under the national unemployment rate.
These figures tie up pretty well with those for the next question, which was about the amount you spend each week on computer games. 79.01% fork out between £2 and £5, 18.51% manage golden tinklies to the tune of £6 to £10 weekly, and then it drops sharply; only 1.86% leave between £11 and £20 on the counter, and an infinitesimal 0.62% can afford over £20 a week. If we take the CRASH readership figure (see below), and allow the average £3.50 per week the 79.01% spend, then it follows that £838,897 and 50p goes into the software industry’s coffers every seven days!
We wondered how many of you are interested in the serious stuff of utilities and asked whether you have purchased one during the past six months, or intend to within the next six. The two sets of figures correlate well, and show that a touch over a quarter of CRASH readers own serious software — a mite more encouraging for utility producers than I had imagined. 26.11% purchased utilities in the past six months, and 28% intend to soon, making something like a potential 85,000 utility sales in the next half year. That’s a big serious whoopee!
The figures for peripherals are similar, but reflect the fact that once a purchase has been made the potential for further sales drops slightly (which isn’t the case with utilities, of course). 30.04% have purchased a peripheral in the last six months, while 23.71% intend to within the next six.
Now we come to new computers, and here there are some interesting answers. Do you intend buying a new machine during the next six months? 26.15% say ‘Yes’ and 73.85% say ‘No’. So what is it that the little over a quarter of CRASH readers want to get? An encouraging 72.8% want a Spectrum 128/+2 or +3; a fairly high 13.6% want a Commodore 64 or 128; 4% are opting for an Amstrad (mostly the CPC664). while 9.6% want to go 16-bit — 8% for the Atari ST and 1.6% for the Amiga.
Enough of the hard stuff and back to games. What’s the major influence on your decision to buy a computer game? Well, highest on the list is a magazine review (and so it should be!) — 27.4% reckon so. Price is a key factor, but it’s pipped at the post by a friend’s recommendation at 17.6% — price comes in at 17.4%. Advertising hype and the game’s software house come next, neck and neck at 13.1%, while authors only poll 11.4% as an influencing factor (probably reflecting the fact that authors are becoming more anonymous as time goes by).
And so to the magazines and CRASH in particular. When did you first buy a copy of CRASH? The elite who got the fabled first issue total 9%, another 8% joined between that and Issue Six with a further 9% up to Issue 12. Things leapt up with 20.2% joining between 13 and 18, 18.4% between 19 and 24, 13.8% between 25 and 30, and another 16.4% up to Issue 36. You obviously like CRASH well enough, too — 74.5% of readers have bought every issue since their first.
Then there’s the vital question of how many literary pirates read your copy (without buying their own — low-down cheats). Across the board it averages out that 3.16 persons read your copy — and if you discover who the .16 of a person is, let me know.
On the question of what other computer magazines you buy or read, Sinclair User comes out top on points by a pipsqueak with 24.55%, closely followed by Your Sinclair at 23.12%. Computer & Video Games notches up 20.79%, the now-defunct Computer Gamer managed 11.63%, Popular Computing Weekly earns 11.56% and the more serious Personal Computer World receives 8.35%.


Charting your favourite CRASH features has become a popular annual event. This year’s questionnaire indicated little change in preference over last year. At the top it’s still PLAYING TIPS (thank you, though most of the credit for that goes to girlie tipster Hannah Smith). Reviews come second, previews third, competitions fourth, special reader offers fifth and Subscription offers sixth. News is next at seventh place followed by the FORUM, the charts and, surprising (but encouragingly enough for the software houses) advertisements in tenth position.

Ever onward; Lunar Jetman makes it in at 11, Simon’s TECH TIPS at 12 and ADVENTURE TRAIL a very lucky 13. TECH NICHE polls place 14, followed by the editorial, a strategically positioned FRONTLINE and PLAY BY MAIL at 17. Hunter S Minson slips in at 18 with CRASH COURSE bringing up the tail at 19.
There were simply too many comments to mention!
Our coverage of software in three categories, namely Reviews, Previews and News comes out at 90.22%, 81.54% and 72.77% respectively.
Onto the reviews themselves. Are they detailed enough? ‘Yes,’ says 85%. Long enough? ‘Yes,’ says 86%. But 55% think there aren’t enough screen shots — a situation unchanged since time began. And 76% think the comments box is sufficiently detailed.
Agreeing with our review ratings can be a touchy subject (see the FORUM almost any month!), but 7.7% always agree with a CRASH review and 75.5% agree more often than not — a pretty good figure I’d say. 14.9% agree occasionally, 1.8% rarely and a negligible niggling 0.1% never agrees.
Should we substantially change the rating system? Here the answer was comfortably conclusive, with 82.6% answering ‘No!’
We double-checked on one of the earlier questions by asking whether you use CRASH as a source of reference when buying games (having established that a magazine review is the major source of influence when buying a game); over half, 58.5%, say they do and 40.6% admit to using CRASH sometimes.
What about the magazine’s covers, often a cause of shock and horror when Oli gets a bee in his bonnet (though several covers within the period covered by this questionnaire were painted by Ian Craig). 66.4% think they are great, 31.7% reckon they’re okay and 1.9% hate them, saying they’re rubbish (but at least the ink doesn’t come off on the fish’n’chips).
There’s more polarisation of feeling when it comes to features like TERMINAL MAN and TAMARA KNIGHT. 24.8% think those two are great, 47.2% rate them as ‘okay’ and 28% dismiss them as rubbish, though individually TERMINAL MAN came out much better, almost 50/50.
CRASH has always avoided a Reader’s Challenge, but we thought it only fair to ask your opinion, and as you know, the answer resulted in last month’s startup form. Here’s the reason why: 85.4% say ‘yes’ to a Challenge, and the preference is clearly for a Reader-versus-Reviewer Challenge — 69.5%.

And talking of reviewers, since we started naming the regular CRASH reviewers we’ve been wondering how often you agree with the individuals, though there’ve been some additions of late. Between Ben Stone, Paul Sumner, Mike Dunn and Richard Eddy the result is — Ben Stone top with 39.2%, followed by Mike ‘Skippy’ Dunn at 30.2%, then Paul Sumner at 21.3% and Richard Eddy with 9.3%. It has to be said that Richard’s lower mark reflects his relatively recent appearance on CRASH review pages.

That concludes the main part of the CRASHTIONNAIRE, but we also asked some other questions about your eating, drinking, viewing and listening habits. On soft drinks 73% of CRASH readers spend up to £1 a week and 25.4% drink between £2 and £5 worth. The estimated average weekly spend is £1.84. Packet foods like crisps fare about the same — 75.6% crunch through £1 worth, with 22.9% consuming £2 to £5 worth. Estimated average weekly spend is £1.71.
Fast foods such as hamburgers clock up a mite more: 65.7% spend up to £1, 29.5% up to £5 and 4.3% up to £10, bringing the weekly average to £2.10.
Fast listening produced some interesting results, because despite the long-standing belief that Auntie Beeb can be the bore, she wins out with CRASH readers — 55.4% listen to Radio One, 32.3% to Local Commercial stations, 10.2% to Local BBC and 2.1% to good ol’ Radio Luxembourg. The average amount of hours spent listening in to radio works out at 8.66.
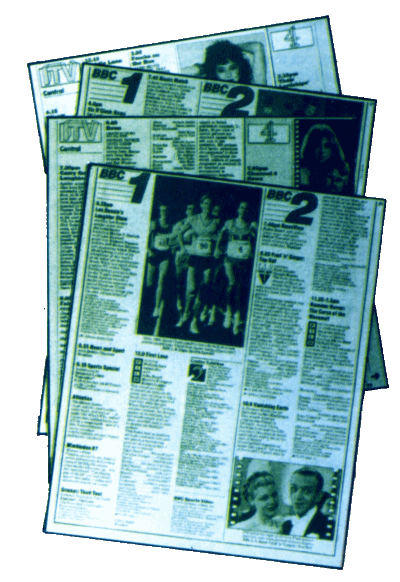
And BBC wins out on the telly stakes too. 52% prefer BBC1, 43% tune in more to ITV, Channel 4 gets a vote of 4% and BBC2 bottoms out at 1%. CRASH readers average a fairly hefty 24.4 hours of watching per week (but not when there’s a telethon on).
And that concludes the votes for CRASH readers. May I thank the returning officer and his staff for their speedy count, and the police for their efforts at crowd control... — but it’s not quite the end of all the business, for there are some CRASHTIONNAIRE prizewinners to mention.
Outright winner for being clever enough to be drawn out of the vast box first is Peter Wallage, and Peter wins himself £50 worth of software, plus a CRASH Cap, T-shirt and Sweatshirt. The four runners up, who each receive £10 worth of software, plus a CRASH Cap and T-shirt, are: Simon Proctor; Edward Askew; Peter Mill; and Way Ken Wong.